Following up on an October Teaching with Technology workshop and a recent post on StoryMapJS, today I will introduce TimelineJS–another product of Northwestern University’s Knight Lab. This tool allows users to plot narrative content along an interactive timeline, with text, images, maps, video, and audio files embedded in a slideshow above. Users can click through the slides chronologically or scroll through the timeline to jump to specific dates/events. Like StoryMapJS, TimelineJS requires no coding skills, but users must work in a Google Spreadsheet template. See the documentation pages for more information about the template’s columns.

Note that the supported media types are all URLs and embed codes. If a user wishes to include an image from their hard drive, they must first publish it to the web somewhere, such as a social media site or photo-sharing platform. There are some potential issues with TimelineJS’s functionality in a Humanities-based project, such as the inability to indicate approximate dates and years. You do not have to enter months and days, but you must determine a year for every entry on your timeline, and the spreadsheet cannot indicate “circa” or approximate ranges on the resulting timeline. If projects are based on personal data, it is important to note that you must publish your Google Spreadsheet to the web in order to create your TimelineJS. The data will likely be visible only to people who know the link, and there are advanced options for privacy control for users with JSON skills.
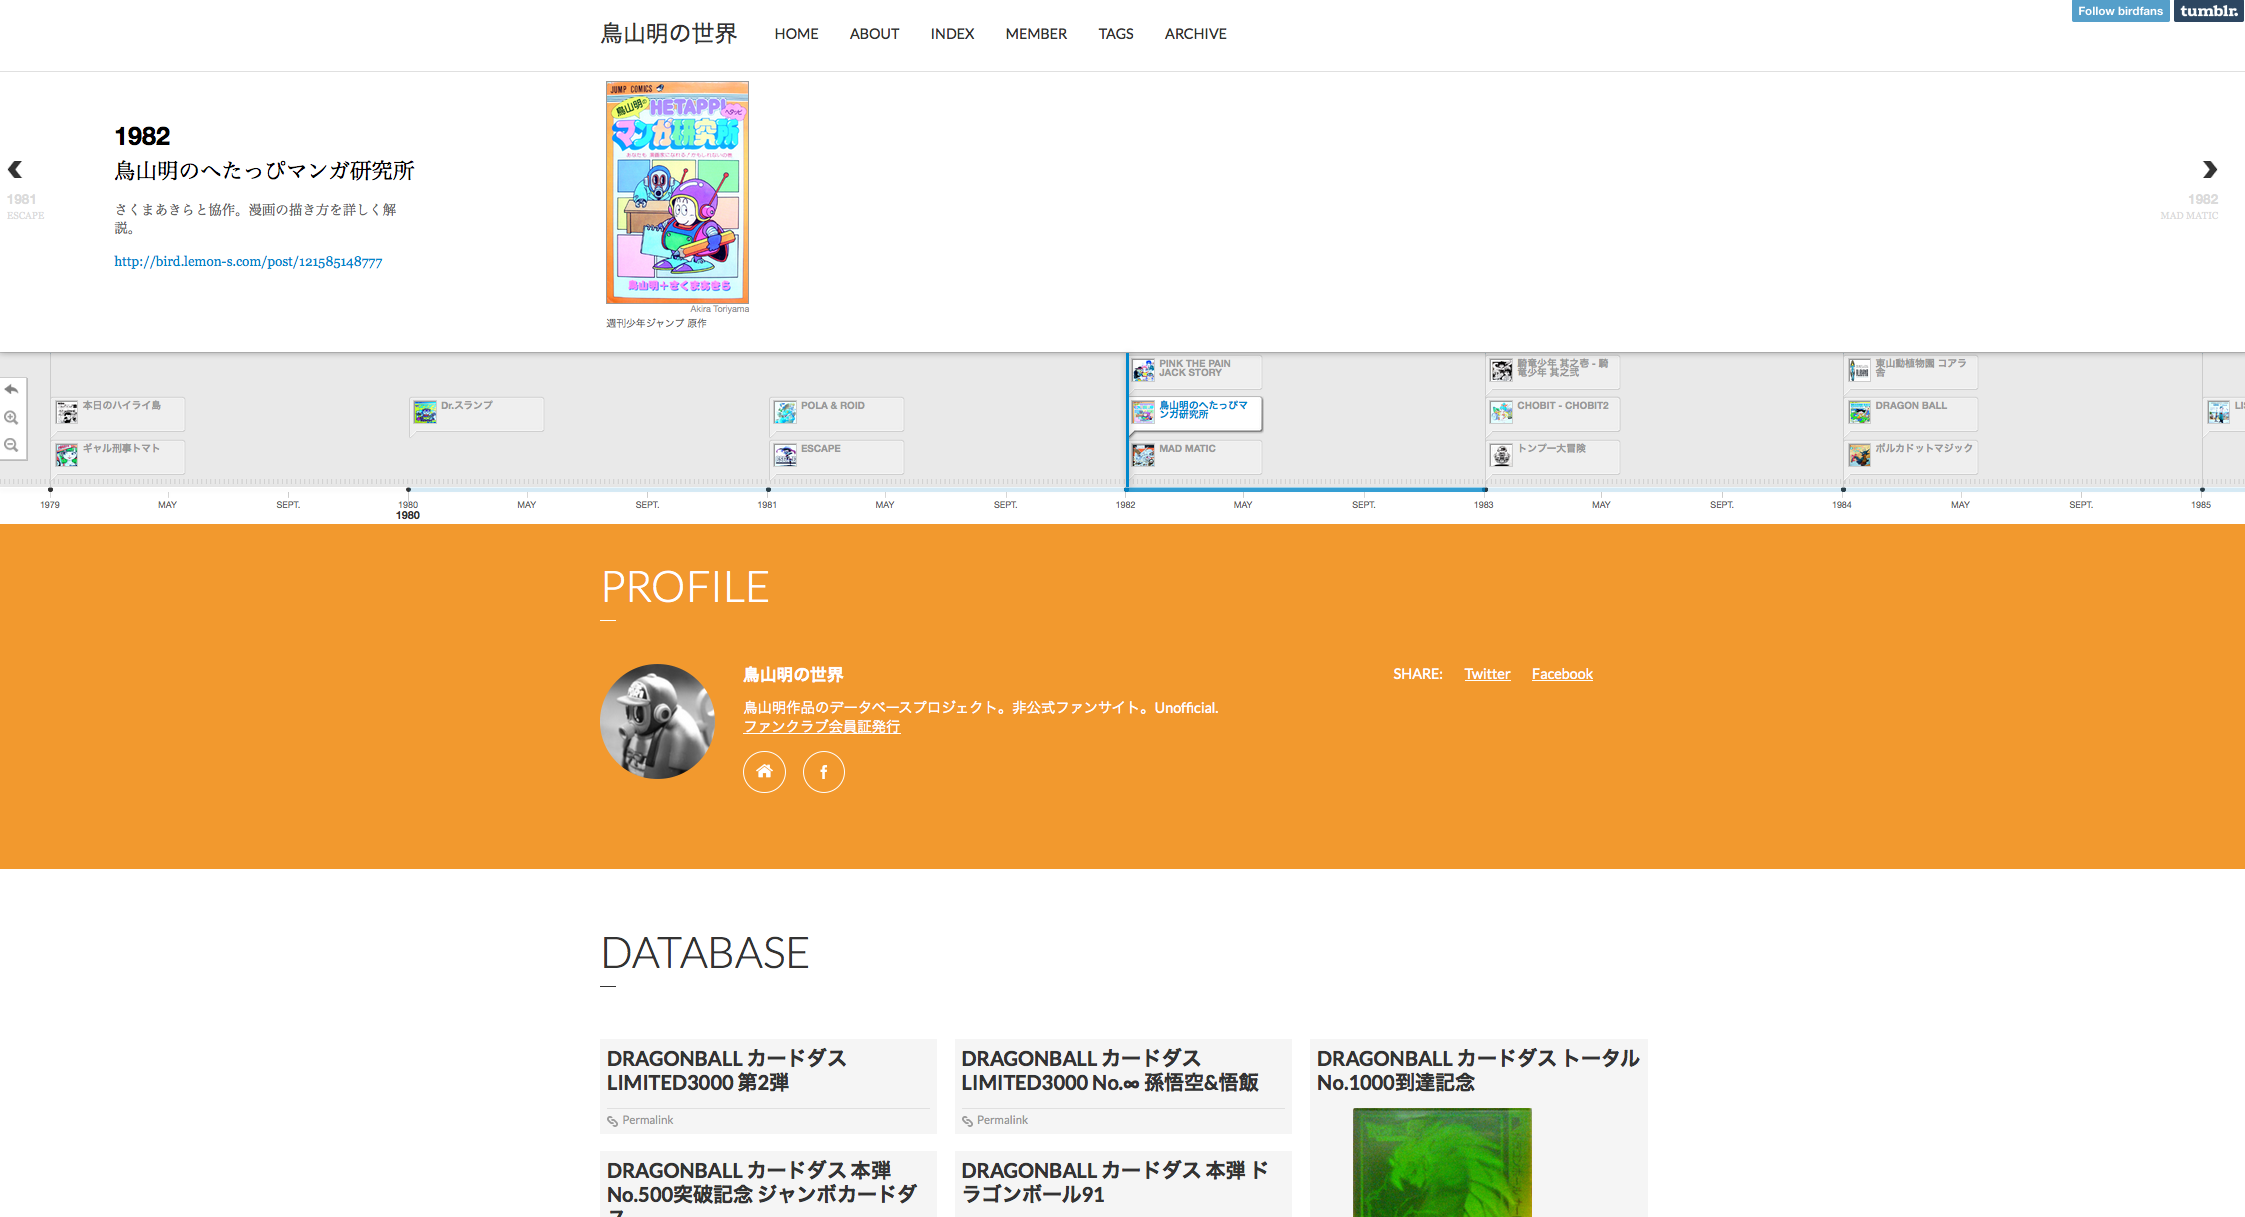
Like all Knight Lab creations, TimelineJS is geared toward people working in the media; however, its narrative and multimedia format would be a great alternative presentation tool for many student projects in which PowerPoint may have been utilized in the past. Timelines can also be embedded into websites to add a new dimension to a web-based project. See the example from a Tumblr site below.